
![]()
![]()
![]()
![]()
![]()
![]()
THE FINANCIAL SIGNIFICANCE OF OPTIMUM WELL-SITE LOCATION
Dr. William M. Turner
- Introduction
- Importance of Aquifer Heterogeneity
- Statistical Significance
- The Reason for Optimal Well Site Location
- Documented Example
- Cost of Failure
- Karst Aquifers
- Thermonic Investigation
Hydrologists and water supply engineers know it is desirable to drill production wells in an aquifer having high transmissivity rather than low transmissivity. Transmissivity is a number that describes how rapidly ground water moves in the aquifer. Wells in high transmissivity aquifers will produce more water than wells in low transmissivity aquifers. Higher capacity wells means fewer wells and lower operation and maintenance costs and less pipeline.
There are two compelling reasons to locate wells in high transmissivity aquifers.
1. For a given production rate the well in the high transmissivity aquifer will have a less drawdown than a similar well in a low transmissivity aquifer. Less drawdown will translates into lower pumping costs because the energy required to lift the water to the surface is less.
2. For similar maximum possible drawdown, the well in the higher transmissivity aquifer has the higher production capacity. Thus, for large water requirements that are greater than the production capacity of a single well, fewer wells will be needed if they are located in an aquifer with high transmissivity to meet the water requirement. Savings in capital investment in wells and equipment and maintenance will be realized by drilling fewer high capacity wells.
THE IMPORTANCE OF AQUIFER HETEROGENEITY
Very few aquifers have reasonably uniform hydraulic properties. With uniformity, it makes little difference from a well production viewpoint where a well is located. One location is just as good as another.
However, most aquifers do not have uniform hydraulic properties. Alluvial, limestone, volcanic aquifers have a wide range in transmissivity. Commonly, transmissivity changes within very short distances. The statistical distribution of transmissivity has been studied for a number of aquifers. AGW scientists have examined the statistical distribution of transmissivity for six aquifers. These studies are found in our reference library.
Supkow (1973) studied the transmissivity distribution of alluvial aquifer in the Tucson Basin aquifer in the State of Arizona in the arid American Southwest. Figure 1 shows the location of the Tucson Basin within the State of Arizona.
In the Tucson Basin, aquifer heterogeneity results from alluvial materials that were deposited on a preexisting erosional surface with a dendritic drainage network. This erosional surface is known locally as the "Rillito" surface.
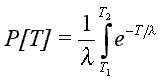
Supkow (1973) found the probability density function (pdf) for the frequency distribution of transmissivity in the Tucson Basin alluvial aquifer is given by:
f(T) = 1/le -T/l for T>0
f(T) = 0 otherwisewhere,
T = transmissivity
l = mean value of transmissivity.The cumulative probability of drilling well into an alluvial aquifer with a specified transmissivity is given by:
You can see that areas of high transmissivity are very scarce and areas of low transmissivity are very numerous. In fact, only 16 percent of the Tucson Basin aquifer has transmissivities in excess of 100,000 gallons per day per foot (gpd/ft) (1,242 m2/d), whereas 52 percent of the aquifer has transmissivities less than 40,000 gpd/ft (497 m2/d).
This means that if you select well locations in the Tucson Basin at random, your chance of finding a poor location is excellent and your chance of finding a good location is very poor. Table 1 shows data used to determine the cumulative probability density function in the Tucson Basin. Figure 2 is a graph of the cumulative probability density function.
Because the alluvial aquifer in the Tucson Basin consists of heterogeneous, channel-fill deposits, the aquifer transmissivity is highly variable everywhere. Just because the aquifer has a transmissivity of 30,000 gpd/ft (373 m2/d) at a particular well site, does not mean that a well drilled 200 feet (61 m) away will have the same transmissivity.
Short-term aquifer-performance tests only sample the part of the aquifer near the well site. A short distance away from a well, the aquifer transmissivity will be significantly different.
Because the PDF in the Tucson Basin is exponential, locating a well is not like flipping a coin. If you were flipping a coin, 50 percent of wells would encounter part of the aquifer with a transmissivity greater than some average, and 50 percent would find an aquifer with a transmissivity less than the average.
Because the PDF for alluvial aquifers and karst aquifers is exponential, you have a greater probability of finding parts of an aquifer with values smaller than the average than of finding part of an aquifer with a transmissivity grater than the average.
In the Tucson Basin, for example, the average value of transmissivity is about 52,000 gpd/ft (645 m2/d). Only 36.8 percent of the transmissivities within the aquifer are greater than the average, whereas 63.2 percent are less than the average.
These percentages hold true for any exponential distribution. For example, if you substitute the average transmissivity of the Tucson Basin aquifer for T2 in the cumulative probability formula and "0" is substituted for T1, you can see that for any area with an exponential distribution of transmissivity, your probability of finding transmissivity values less than the average is always 63.2 percent and your probability of finding transmissivity values greater than the average is always 36.8 percent.
The ratio of 63.2 and 36.8 percent is 1.72. This means that your probability of our finding a part of the aquifer with a transmissivity of less than the average is nearly twice that of finding a part of the aquifer with a transmissivity greater than the average.
In the same way, you can demonstrate that the probability of finding transmissivity values that are smaller than one-half the average value is 39.4 percent and your probability of finding transmissivity values that are greater than twice the average value is 13.5 percent. This gives a ratio of 2.91. This means that the probability of your finding transmissivity values having smaller than one-half the average value is nearly three times greater than your probability of finding transmissivity values greater than double the average transmissivity.
This discussion is important because when you select a well site, you are not interested in the average transmissivity value of the aquifer. You must be interested in the extreme high value of transmissivity. But, because of the exponential probability distribution of transmissivity within the aquifer, the most probable transmissivity values are in the extreme low range.
You may want to believe that some parts of an aquifer are homogeneous and that some parts have transmissivity distributions that are other than normal. However, there is no known physical evidence that any part of any aquifer is homogeneous. Different performance characteristics of adjacent wells are known to all hydrologists and water engineers. This demonstrates nonhomogeneous conditions.
OTHER ALLUVIAL AQUIFERS
Rao (1991) studied the statistical properties of the transmissivity distribution for the Shallow Alluvial aquifer of the Roswell Artesian Basin of New Mexico, also in the arid American Southwest. Figure 3 shows the location the Roswell Basin in the State of New Mexico. You can find a more detailed description of Rao's work on the Shallow Alluvial aquifer revised by Turner (1999) in our reference library.
Based on the data compiled by Rao (1991), and reviewed by Turner (1999), a statistically significant lognormal PDF was determined for the Shallow Alluvial aquifer of the Roswell Basin.
Turner (1999) has analyzed transmissivity data from the alluvial aquifer of the Estancia Basin of central New Mexico. Figure 4 shows the location of the Estancia Basin. You can find a more detailed description of this work on the Alluvial aquifer of the Estancia Basin in our reference library.
Turner (1999) found a statistically significant lognormal PDF for this alluvial aquifer also.
THE REASON FOR OPTIMUM WELL-SITE LOCATION
Now that you have at your disposal equations giving the probability distribution of transmissivities in alluvial basins, you should place this information to use and select optimum well sites where the aquifer will have the highest transmissivity.
Unfortunately, the PDF is a frequency distribution and not an areal distribution. You cannot locate an optimal well site simply by knowing the frequency distribution. The PDF says nothing about where the high transmissivity zones are located within a particular area. Therefore, unless you have some a priori information about the spatial distribution of transmissivity within an area, any exploration drilling program, other than a complete saturation drilling scheme, is doomed because the probability of finding the highest transmissivity values in any area is small regardless of the size or location of the area.
The following documented example shows the economic losses associated with uncertainty in the areal distribution of transmissivity within the Tucson aquifer. The project was conducted some years ago. Only the costs have increased. The costs are in US Dollars.
In 1969, the Tucson Water Department conducted an exploratory drilling program along the eastern boundaries of Townships 16 and 17 East of Range 1 South, south of Tucson, Arizona. The drilling program at that time cost $30,000 and consisted of 5 mud-rotary, drilled holes, 5.5 inches (14 cm) in diameter and 1,000 feet (305 m) deep.
On the basis of grain-size analysis and electric logs of the test holes, only one site was judged to be suitable for a production well. Subsequently, a production well was drilled and constructed at this site. Thus the exploration costs for this well were $30,000 not including the cost of electric logging and well completion.
To assist in evaluating the economic impact of uncertainty in the areal distribution of transmissivity within an alluvial aquifer, AGW scientists performed a computer simulation of a hypothetical aquifer having an approximate exponential transmissivity frequency distribution. Our hypothetical model is not the same model we developed for the Tucson Basin. The hypothetical model contains a variable grid spacing in which the nodes in the central part of the model are spaced 100 feet (30 m) apart. Nodes farther from the central part of the model had progressively wider spacing up to 12,800 feet (3,900 m) at the boundary of the model. The areal extent of the model was 51,900 by 51,000 feet (15,819 by 15,545 m). This is sufficiently large to eliminate boundary effects during a simulated aquifer-performance test at locations within the model.
The model simulates a paleo-river channel filled with well-sorted clastic material surrounded by bands of lower permeability rock. The frequency distribution of transmissivity is approximately exponential.
We placed hypothetical wells at different locations within the model and pumped them for 1,000 days at each location at the rate of one million gallons per day (3,785 m3/d). We also pumped a well in the center of the paleo-river channel deposits at 2 million gallons per day (7,570 m3/d).
The simulations showed that the well in the center of the paleo-river channel, pumping at 2 million gallons per day (mgd) (7,570 m3/d), has less drawdown than the hypothetical well that misses the channel by only 300 feet (91 m) and that produces 1 mgd (3,875 m3/d).
If we did not know the areal distribution of transmissivity in the hypothetical model, we would have only a 19 percent probability of locating a well site anywhere in the zone of highest transmissivity. Uncertainty in the areal distribution of transmissivity has a very significant economic cost that can be evaluated in the following way.
Suppose that two entrepreneurs each decides to exploit the water resources in an area having aquifer properties similar to those of the hypothetical model. Assume that each entrepreneur has exactly the same total water requirements and that each wants to minimize his well investment cost. Assume further that one entrepreneur knows where the zone of high transmissivity is located; but, the other does not. The probability that the knowing entrepreneur will put his wells in the zone of high transmissivity is 100 percent. The probability that the unknowing entrepreneur will do the same is less than 19 percent.
In terms of pumping costs over the long run, the unknowing entrepreneur will suffer only slightly as compared to the knowing entrepreneur. For similar drawdowns, two wells in poor locations are required to pump the same quantity of water as one well in the optimum location.
In terms of capital investment, the unknowing entrepreneur must invest at least twice as much scarce money in well drilling, pumps, equipment, pipeline and maintenance as the knowing entrepreneur. This estimate is conservative because the proportion of low transmissivity areas in the model is less than it would be in a truly exponential distribution. That is, much of the area given a transmissivity value of 10,000 gpd/ft (124 m2/d) would be assigned lower values if the distribution were more nearly exponential.
Based on the experience of the hypothetical entrepreneurs, we can now proceed to estimate the economic loss to a typical real-life entrepreneur resulting from uncertainty in transmissivity distribution, namely the City of Tucson Water Department. The Tucson Water Department released the following cost data in 1971:
ITEM
COST
USD/ACRE FOOTCOST
USD/1000 CUBIC METERSPower $ 7.02
$ 5.69
Well Construction $ 1.80
$ 1.46
Equipment, insurance, land maintenance and administration $ 15.60
$ 12.65
TOTAL
$ 24.72
$ 19.80
The Tucson Water Department purchased its own well-drilling rig because it could reduce well-drilling costs by 50 percent. The future costs of producing water, exclusive of power costs, will be about $16.50 per acre-foot ($13.38 per 1000 m3).
Projected water demand for the following 10 years indicted an increase in demand of about 5,000 acre feet per year (6,166 m3/y). The total additional water expected to be pumped over the 10-year period is about 275,000 acre-feet (339 million cubic meters). The total non-power cost to the city as an unknowing entrepreneur of producing this water at 1971 rates will be about $4,537,500 over the 10 years.
If the Tucson Water Department were a knowing entrepreneur and could put all of its future wells in optimum locations, based on the conservative estimate of the previously described hypothetical model, the Water Department could produce the same quantity of water with half the number of wells. This would cut the non-power costs of producing the additional water almost in half at a savings of about $8.00 per acre-foot ($6.48 per 1,000 cubic meters). Over the 10 years ending in 1981, the savings would amount to about $2 million.
This $2 million represents a real cost to the government and the ratepayer that can be avoided. The $2 million is the cost of uncertainty in not knowing the precise transmissivity distribution in the aquifer at any location.
The discussion here has primarily focused on alluvial aquifers. Two limestone karst aquifers have been studied in detail: the San Andres Limestone and the Madera Limestone aquifers in New Mexico, U.S.A.
The statistical distribution of transmissivity of both of these aquifers was determined using a rich data set developed from aquifer-performance tests performed by many hydrogeologists over the past 50 years. The studies dealing with the San Andres Limestone and the Madera Limestone are detailed in our reference library.
In both cases, lognormal probability density functions describe the statistical distribution of transmissivity within the limestone aquifers. The discussion relating to ground-water exploration in alluvial aquifers applies equally to limestone aquifers.
If you are the unknowing entrepreneur, the part of investment that you must make above the investment of the knowing entrepreneur represents the cost of uncertainty caused by the exponential transmissivity distribution of the aquifer. The cost of uncertainty in the areal distribution of transmissivity within an aquifer is a cost that can easily be avoided. By making a simple, inexpensive Thermonic geophysical survey and using other modern geological and geophysical methods to determine the areal distribution of transmissivity within an aquifer under investigation, the uncertainty in the distribution of transmissivity can be reduced to zero.
The Thermonic survey in the aquifer is a negligible expense to eliminate the uncertainty in transmissivity distribution. This eliminates large unnecessary cost. Even if you are ultraconservative and estimate that a Thermonic survey could reduce the number of required wells by only one, the savings of the cost of the well and future operations and maintenance cost of the single well could pay for the cost of the survey plus royalties. In fact, the cost of the Thermonic survey plus royalties or annual fees are, in part, deferred costs paid for by ratepayers rather than up front costs for new wells needing hard to find money.
The many successes of integrated ground-water exploration surveys including Thermonic surveys are detailed in our case histories.
![]()
![]()
![]()
![]()
![]()
![]()
? 1999-2016 AGW Consultants. All Rights Reserved.